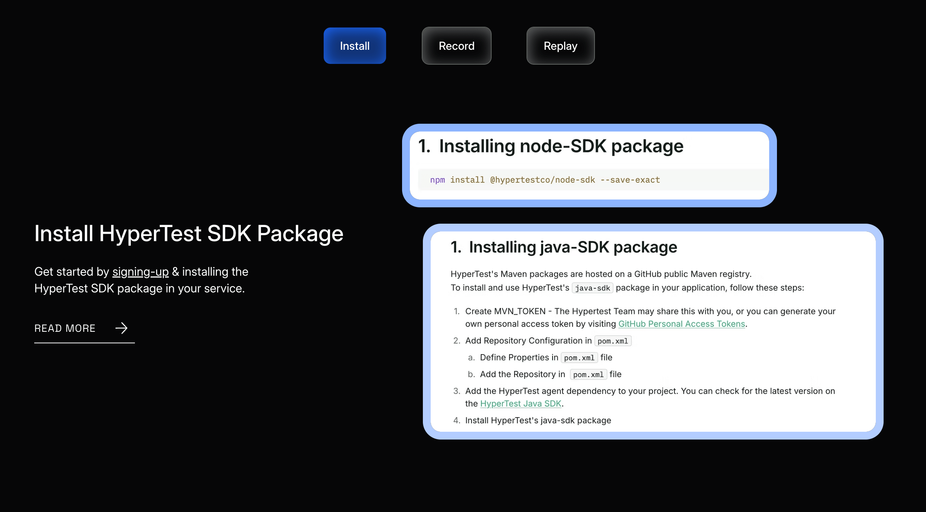
Install the VS Code extension
Open VS Code and go to the Extensions panel (
Ctrl+Shift+X / Cmd+Shift+X). Search for HyperProbe and click Install.The extension adds a HyperProbe icon to the activity bar. Click it to open the HyperProbe panel.Configure the extension
HyperProbe needs to know where your backend server is running. Open VS Code settings (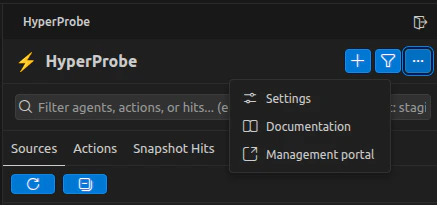
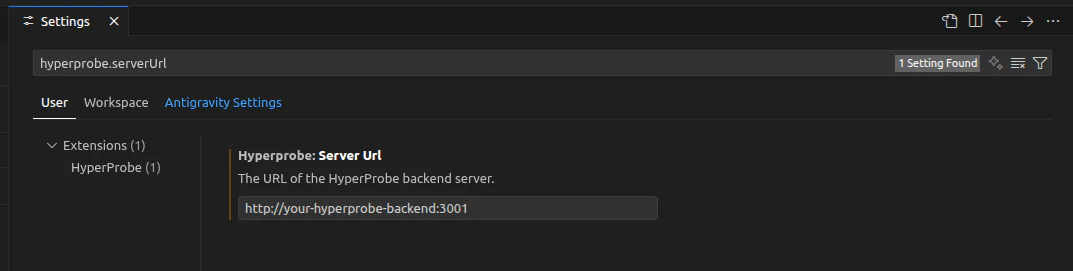
Ctrl+, / Cmd+,) and search for hyperprobe.serverUrl.or you can directly open HyperProbe Settings.Login and Access the Dashboard
After completing the previous steps, a Login button will appear in the HyperProbe panelClicking this button will redirect you to the HyperProbe dashboard.Before logging in, ensure that: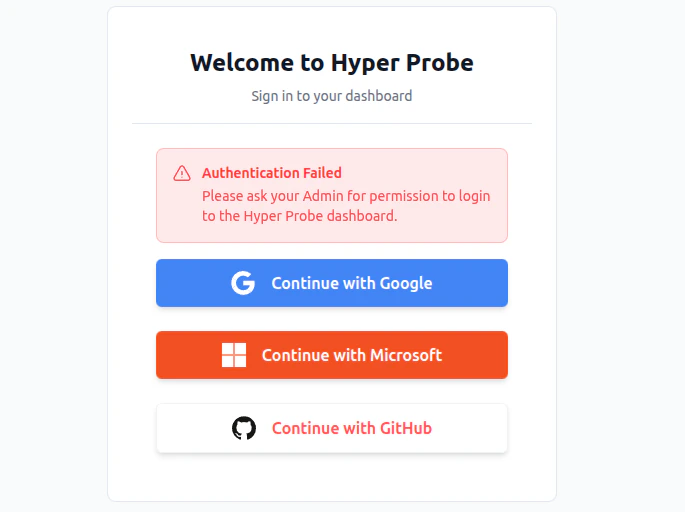
- You are an authorized user
- You have been added to at least one team by your administrator
- Log in using SSO.
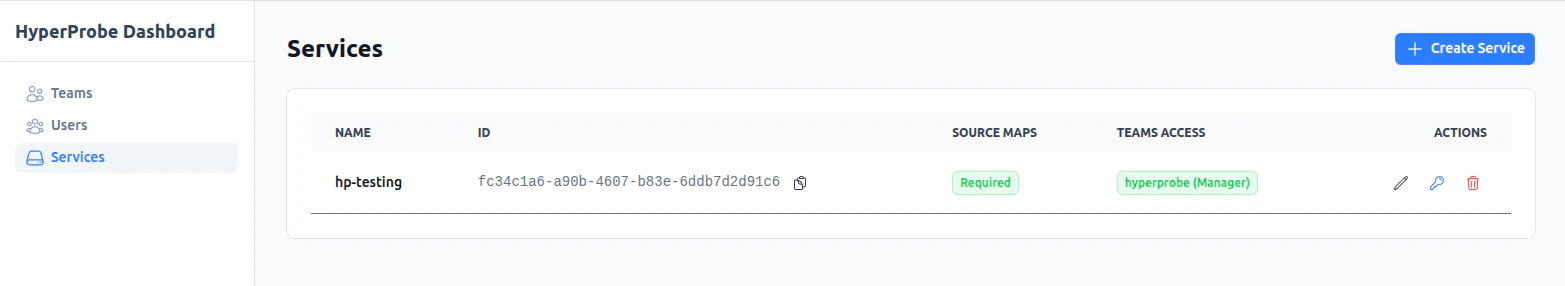
- After successful login, you can create and manage your services from the dashboard.
Add a .hprc file to your project
Create a The
.hprc file in the root of your project. This file tells HyperProbe which service the probes in this repository belong to..hprc
serviceId must match the value you pass to HyperProbe.start() in the next step. The VS Code extension reads this file automatically when you open the project.Initialize the agent at startup
Call The four required options are:
HyperProbe.start() as early as possible in your application’s entry point — before any other application code runs. This gives the agent time to connect to the broker and receive active probes before your service starts handling requests.| Option | Description |
|---|---|
serviceId | Matches the serviceId in your .hprc file |
environment | The deployment environment (e.g. production, staging) |
brokerUrl | gRPC address of the HyperProbe broker |
commitSha | Git commit SHA for source map resolution |
Set your first probe
With your application running and the extension configured: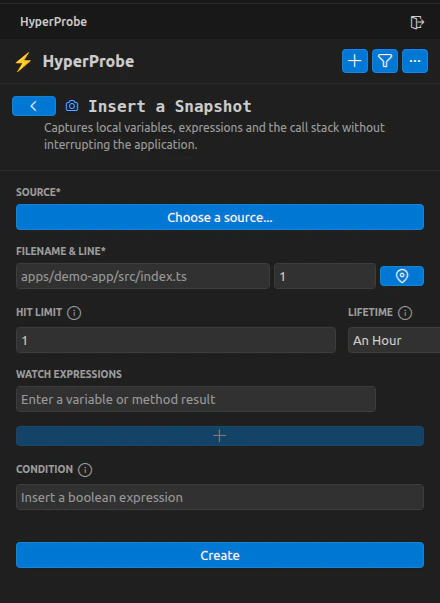
- Open a source file in VS Code.
- Check for the line of code you want to instrument.
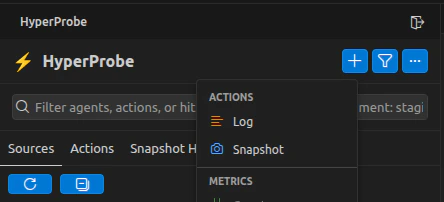
- Insert a Snapshot from the context menu.
View captured data
The next time production code executes the instrumented line, the agent captures the local variables and call stack. Open the HyperProbe panel in VS Code to see the result.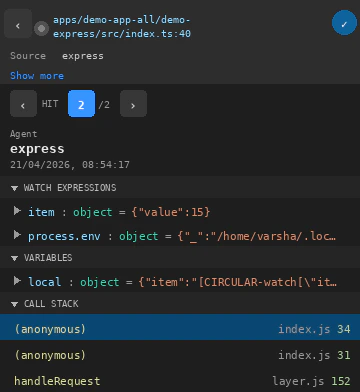
The agent polls for active probes periodically (every 60 seconds by default). New probes may take up to one sync cycle to become active. You can reduce this with the
syncIntervalMs option.Next steps
How it works
Understand the full probe lifecycle, from VS Code to capture and display.
Probe types
Explore Snapshots, Logs, Counters, Metrics, and Tic & Toc probes.
SDK configuration
Tune safety guardrails, data limits, and queue behavior.
Safety guardrails
Learn how HyperProbe protects your application from instrumentation overhead.